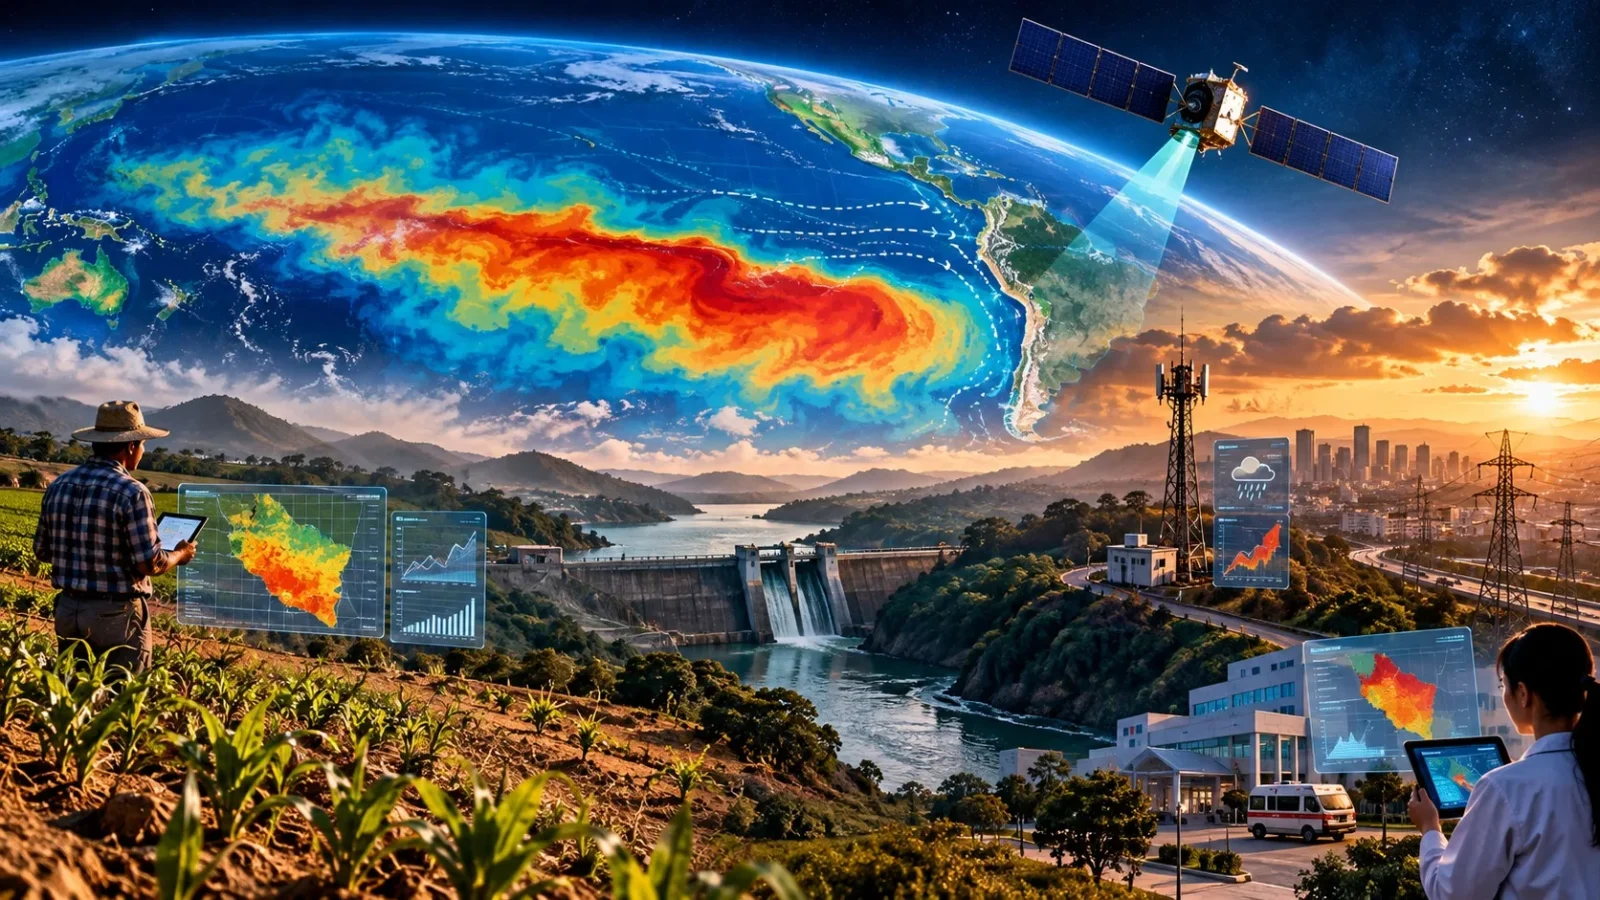
Satellites can track warm water moving across the Pacific. Ocean buoys can tell us what is happening below the surface. Climate models can forecast what might happen months ahead. The more difficult problem is to convert those measurements into decisions before drought, heat or flooding reaches people and infrastructure. The most recent official NOAA assessment, as of Oct. 7, 2026, still points to an unusually strong El Niño.
On Sept. 10, NOAA’s Climate Prediction Center said El Niño was intensifying and had a greater than 90% chance of becoming a very strong event during the fall and winter of 2026-27 in the Northern Hemisphere. The agency pegged the August Niño 3.4 index at +1.8°C, and said temperature anomalies were above +3°C in parts of the eastern equatorial Pacific. The next scheduled ENSO diagnostic discussion from NOAA is October 8, 2023. The World Meteorological Organization is equally adamant about persistence. The September update put the odds of El Niño persisting through February 2027 at close to 100%. The WMO said the event is forecast to further intensify and peak around the end of 2026. Its seasonal outlook for September-November projects the ensemble mean Niño 3.4 temperature anomaly at about 3.6°C.
Those forecasts are important, but a climate probability isn’t yet an operational decision. A farmer is considering whether he should plant later. The operator of a reservoir must decide whether to look at the storage rules. A power company is looking to find out which assets are more at risk from the weather. There needs to be prior notice to a hospital of any potentiality of increase in heat, water disruption or disease risk. The tech problem starts somewhere between those two points: the forecast and the action.
El Niño now has a network of watching machines
The Pacific is too big to be understood by any single instrument. NOAA collects live data on El Niño from sources such as the Tropical Atmosphere Ocean buoy network, drifting buoys, subsurface observations and Argo profiling floats. Combined, these systems measure conditions on and below the ocean’s surface. And satellites are another layer.
NASA and its European partners have been tracking the 2026 event from Sentinel-6 Michael Freilich. Earlier this year the satellite detected a broad pulse of warmer, higher water flowing east toward South America. It was a Kelvin wave, a pattern in the ocean that can be one of the harbingers of El Niño. By mid-May, sea level in parts of Peru was over 15 centimeters above the long-term average. Warm water expands . By measuring ocean height , scientists can monitor where heat is flowing through the Pacific .
In June, NASA said Sentinel-6 data showed the new El Niño declaration was still strengthening. Its ocean-altimetry service continues to release new measurements, with sea-surface-height records available through October 6, nearly live. Now Sentinel-6B joins its predecessor. Now the two satellites are flying mere seconds apart, gathering precise measurements of ocean height during the 2026 El Niño. The result is a constantly refreshed view of changes taking place over a vast body of water – something earlier generations of forecasters could only build with fewer observations. The map is not the useful output. It is the chain after the map.
Think about what needs to take place before an El Nino observation is useful to a city or a business. The ocean and atmospheric instruments take measurements first. Forecast centers merge observations with numerical models. Seasonal systems forecast the possible evolution of ENSO. Regional forecasts predict rainfall and temperature patterns. Weather forecasts for shorter ranges narrow down the timing. Only then can local information come into play.
Storage levels are in a reservoir database; Farm system includes crop type and sowing dates. A utility knows the location of its substations. Telecom company knows where backup power is weak in towers A hospital has a capacity for beds and personnel. In practice, the useful technology chain looks something like this: ocean observations feed an ENSO forecast; the ENSO forecast feeds regional climate probabilities; regional probabilities are combined with shorter weather forecasts; local sensors and asset records add the condition on the ground; operating rules determine whether anyone needs to act; the action and its result are recorded. That last bit is where climate software can be a lot more useful.
There’s a place for AI weather prediction, but it doesn’t replace ENSO science
It is already a component of operational weather prediction. On May 12, 2026, the European Center for Medium-Range Weather Forecasts launched version 2 of its Artificial Intelligence Forecasting System. The upgrade affected both the single forecast and ensemble system and also an update to ECMWF’s physics based Integrated Forecasting System. AIFS v2 also added data-driven forecasts for waves and snow cover.
It is tempting to sum all of this up in a headline that says AI predicts El Niño. That would be a wrong description. Forecasts of the ENSO rely on observations of the ocean and atmosphere, climate models, statistical models, historical data and expert judgment. The official NOAA outlook is a synthesis of multiple models from the U.S. and other countries.
AI weather forecasting systems are another link in the chain. They can provide useful short-term forecasts of the atmosphere as an event approaches. They keep on with physics based forecasting. A seasonal El Niño forecast might advise a country that its drought risk has increased. Weather forecasts can help determine when a particular district is most vulnerable, weeks or days in advance. Those are predictions on different parts of the same operational problem.
TechSota suggested El Niño control room
Another climate model may not be the next useful step. It may need software that links forecasts to local operations. A proposed El Niño control room could digest official forecasts from meteorological agencies, satellite observations, local weather feeds and sensor measurements. It could then check that data against a geographic register of farms, reservoirs, hospitals, electrical infrastructure, mobile towers, roads and other exposed assets. What would happen next would be rules.
If reservoir storage is below a certain level and the probability of deficient rainfall is above an approved level, the system can ask for a water-planning review. If a farming district is classified as being at high risk of drought, when the soil moisture is already low, the agricultural authority could issue a warning. If the flood forecasts align with mobile sites having a limited battery capacity and only one access road, the operator could schedule an inspection before the conditions deteriorate.
What matters is not a warning generated by an AI on a dashboard. It is the transformation of an approved forecast into a traceable task Each task should identify the source of the forecast, time of publication, geographical area, threshold used, and the person or system that approved the action. Then the decision can be audited afterward. Agriculture already shows how useful this can be.
One of the clearest examples of climate information coming closer to local decision-making is the Food and Agriculture Organization. The Food and Agriculture Organization’s Agricultural Stress Index System, or ASIS, uses satellite observations to monitor agricultural areas where water stress or drought may be developing. The system combines Earth observation data with measures such as rainfall estimates and vegetation health and is updated three times a month.
FAO used 41 years of satellite imagery for El Niño 2026 to identify areas that have had strong and very strong El Niño events that have been associated with severe agricultural drought in the past. In some crop and pasture areas of the Sahel, Southern Africa, South and Southeast Asia, Central America and the Caribbean, probabilities of drought were greater than 50 %. The maps can achieve a spatial resolution of approximately one square kilometer. Cambodia is one current example.
Earlier analysis by the FAO placed Cambodia at high risk of severe drought during the 2026 El Niño, the agency said on October 5. It estimated that agricultural and pastureland totaling 127,300 hectares could be affected. The next technical step is easy to imagine. So take that drought map, and superimpose it with field boundaries, crop type, planting date, irrigation availability, recent rainfall and local soil readings.
A single district may have a planting warning. Another may require more careful irrigation monitoring. The third may not need intervention since local water conditions are still good. When a global El Niño forecast can include such local context, it becomes useful.
Power, water and telecom systems require the same conversion
A similar problem confronts infrastructure operators. Seasonal information is too crude for the operation of an electrical grid, a reservoir, or a mobile network. Local conditions determine if a climate anomaly becomes an operational problem. A power operator could combine probabilities of rainfall with levels of hydropower reservoirs, temperature forecasts with the expected electricity demand, and exposure to floods or wildfires with transmission assets.
For example, a water authority could add seasonal rainfall data to reservoir storage, groundwater levels, river gaugings, treatment capacity and pumping stations. A mobile operator could compare flood, heat or landslide exposure with the locations of towers, access roads, battery duration, generator status and backhaul connections. “The same El Nino forecast would result in a different action for each operator because their assets, thresholds and tolerances are different. The software should be aware of these differences.
Public health needs local triggers not a global ENSO number
5 September WHO published a Global Public Health Situation Analysis for El Nino 2026. It was designed to support risk assessment, preparedness, anticipatory action and health system readiness at the country and regional levels. Health impacts can come via several routes: heat exposure, water disruption, flooding, food security and conditions that affect disease transmission.
A health system could integrate authorized weather and climate information and hospital capacity, ambulance demand, water-quality data and disease surveillance. Dangerous heat may result in a review of staffing levels or cooling capacity. Flood warnings could mean checks on access to medicine and safety of drinking-water. What does matter is that the software should use rules that have been approved by health authorities. It must not provide medical advice based on a weather forecast.
Generative AI should be warning, not creating the hazard
The potential utility of large language models still exists. Suppose an approved risk record shows a particular farming district has exceeded a drought threshold. The record contains the location, forecast period, probability, source, publication time and recommended action. A language model could convert that record into a short SMS, a local-language voice message, an extension worker briefing or a call-center script.
It should not be calculating a new drought probability. It should not silently change the forecast. It shall not determine that a reservoir release, evacuation, or medical intervention is necessary. Those decisions need agreed rules, specialist systems and human authority. Generative AI is better suited to be close to the communication layer, where it can help present an existing decision to various audiences.
APIs are as integral to climate information needs as dashboards.
Many climate products continue to be visual. Somebody opens a map, reads a bulletin and makes a decision. Machines need something a little more structured. Consider an El Niño risk record that contains the issuing organization, the forecast boundary, the forecast time period, the probability of the forecast, model or version of the forecast, the variables involved, the time of issuance, and the expiration time.
Software could allow governments or companies to subscribe only to the records they needed for their assets. An agricultural department could request drought data for crop districts. A water company might look at certain catchments. A logistics operator could scan ports and road corridors. A telecom provider could be subscribed to hazards around network sites.
The original source would remain linked as the data traveled through other systems. This approach would also facilitate corrections. Systems that depend on the earlier record could detect decisions based on the outdated version when an agency modifies a forecast. Climate information would be more like operational data than a static report.
The software has to survive uncertainty
No system should turn an El Niño probability into a promise of local weather. NOAA emphasizes that the effects linked to El Niño are more likely, but not certain, with an event of this intensity. That distinction must be visible all the way to the user. If a forecast calls for a 60% chance of a certain seasonal condition, the app shouldn’t translate that to “drought will happen.”
Instead, organizations can associate different probabilities with different actions. A low-cost inspection might be warranted at a lower threshold. An expensive operational change may require the more persuasive local forecast and human approval.” It is not about getting rid of uncertainty. It is to determine what is to be done while uncertainty still lingers.
Time for it to return the tech
The effectiveness of an El Niño technology system should not be measured by the number of dashboards it produces. The more useful measure is time. How many days prior did a farmer get an advisory? Did they check a vulnerable telecom site before the road flooded? Did a hospital check staffing before a spell of dangerous heat?
Did a reservoir operator receive updated rainfall information in time to review storage plans? Did authorities know what communities needed help before losses showed up in conventional statistics? The 2026 El Niño is a rare live fire drill for this strategy.
Measurements are being recorded by ocean buoys. Sentinel satellites watch the Pacific from space. Seasonal models are forecasting the next step. AI weather models are now running in parallel with existing numerical forecasting systems. FAO is mapping agricultural exposure using decades of satellite records. WHO is giving guidance on health preparedness.
So the engineering problem left is how to connect those pieces to where someone can still change an outcome. El Nino can’t be stopped. But the gap between perceiving risk and responding to it can be shortened.